投稿を報告する
関連記事
-e1684916360946.jpg)
仮想通貨ACH(Alchemy Pay)とは?特徴や今後の見通し・将来性を徹底解説2024-12-31 17:22:03仮想通貨の世界では、常に新しいプロジェクトやトークンが登場し、注目を集めています。その中でも、最近注目を浴びて […]

アルファベット(グーグル/Google)株価は今後どうなる?価格予想や見通しを徹底解説2024-12-31 15:22:42グーグル(アルファベット/Google)は、1998年に設立され、検索エンジンのグーグルやユーチューブで知られ […]
ウォレットとは?作り方を徹底解説-e1662112992149.jpg)
Piウォレットとは?Pi Network(パイネットワーク)ウォレットの作り方を徹底解説2024-12-31 13:42:11この記事を読んでいるあなたは、 Pi Network(パイネットワーク)とは?その特徴を知りたい Pi Net […]
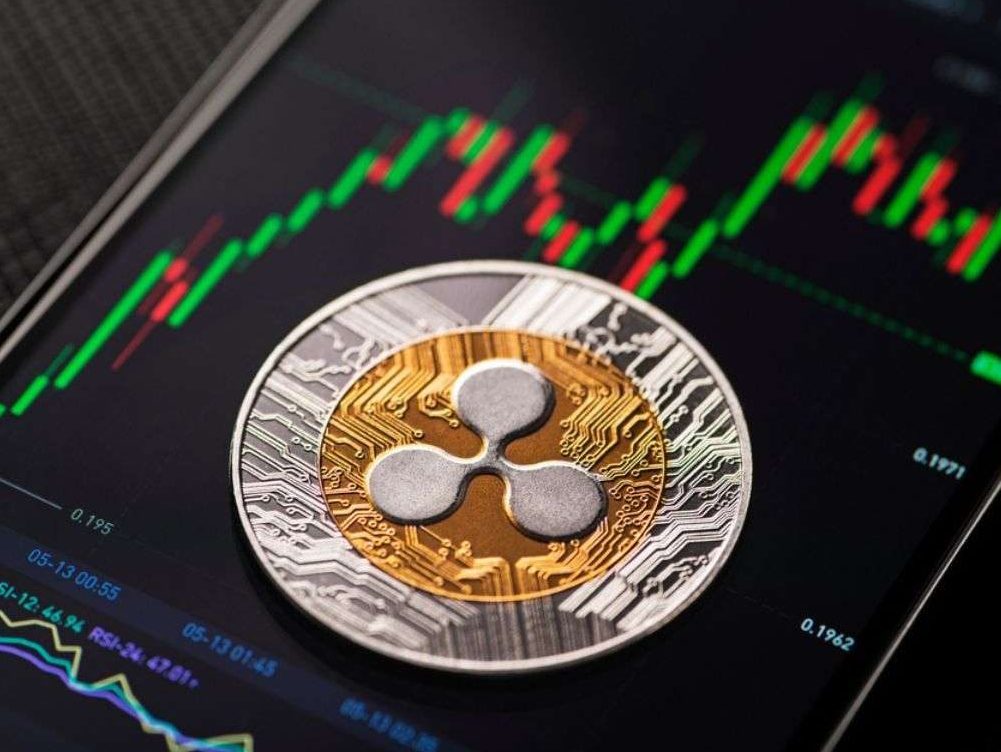
-2-e1714124147666.jpg)
仮想通貨ヘデラ(HBAR)の今後の見通し・価格予想を徹底解説2024-12-31 11:21:08ヘデラ(HBAR)とは、持続可能なエンタープライズ・グレードのブロックチェーンを提供することに焦点を当てた堅牢 […]
リップル(XRP)は100万円になる?今後将来性ない?リップル裁判や2030年の価格予想を解説2024-12-31 10:37:03この記事を読んでいるあなたは、 XRP(リップル)今後はどうなる?その将来性を知りたい XRP(リップル)は今 […]
